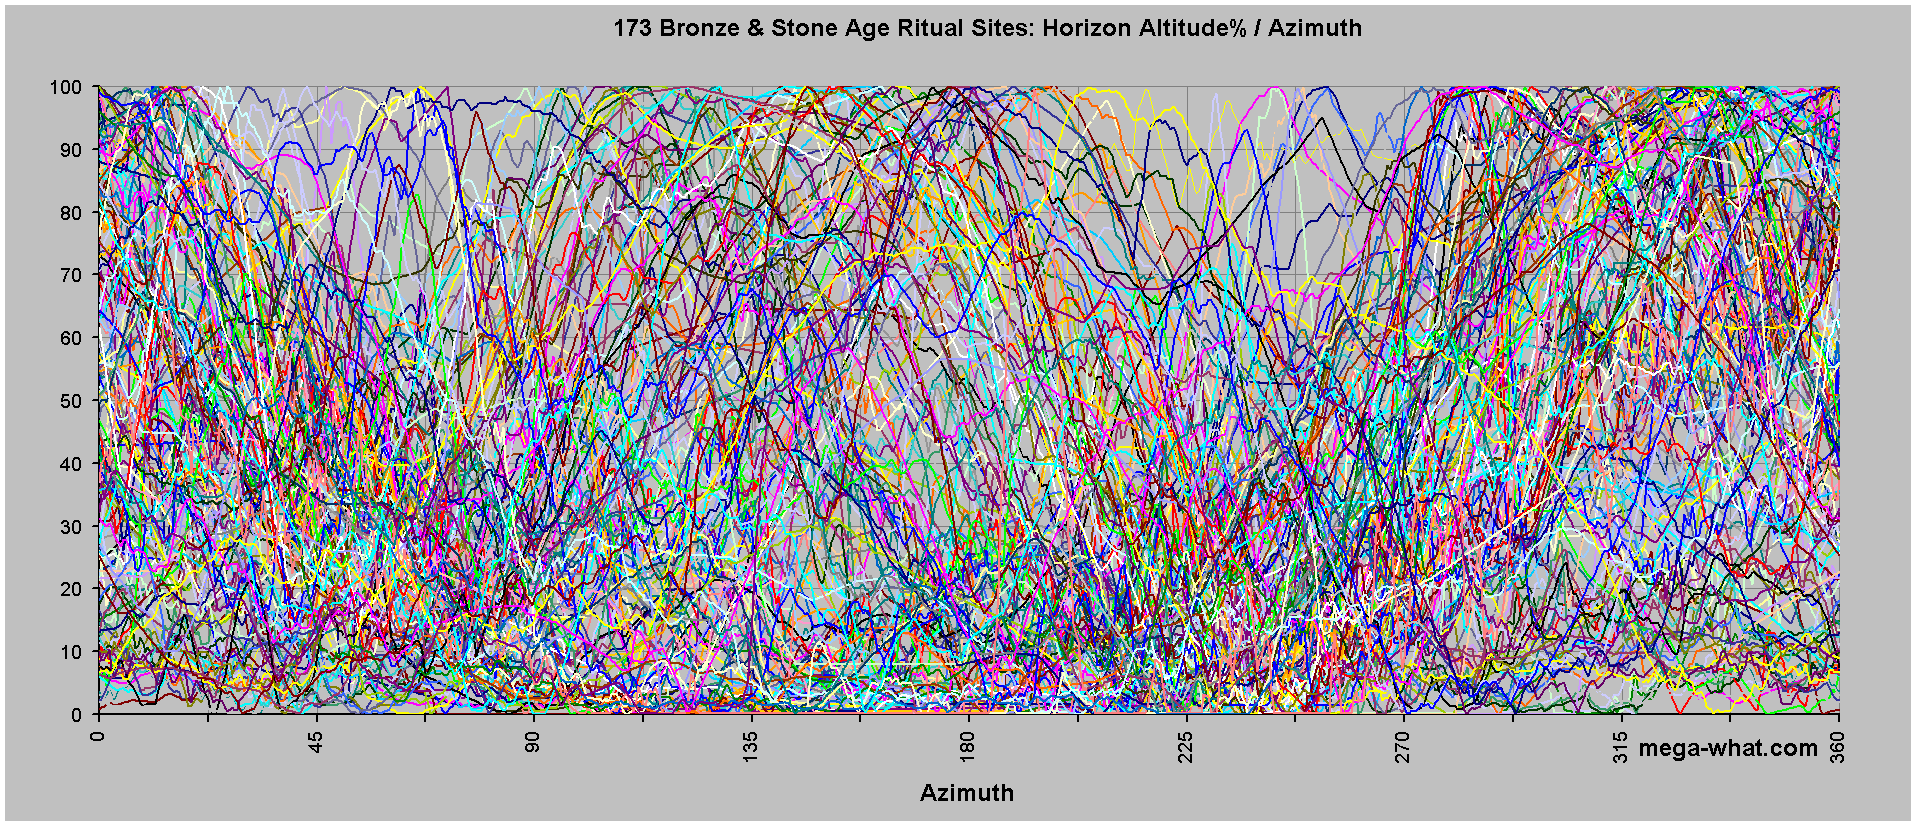
These surveyed horizons have been standardised by expressing their altitude (elevation) as percentage of overall spread rather than absolute value. Thus, for each surveyed site, the lowest dip is 0% and the highest height is 100%.
 Plotting all horizons individually shows an apparent tendency towards structure despite significant individual variability.
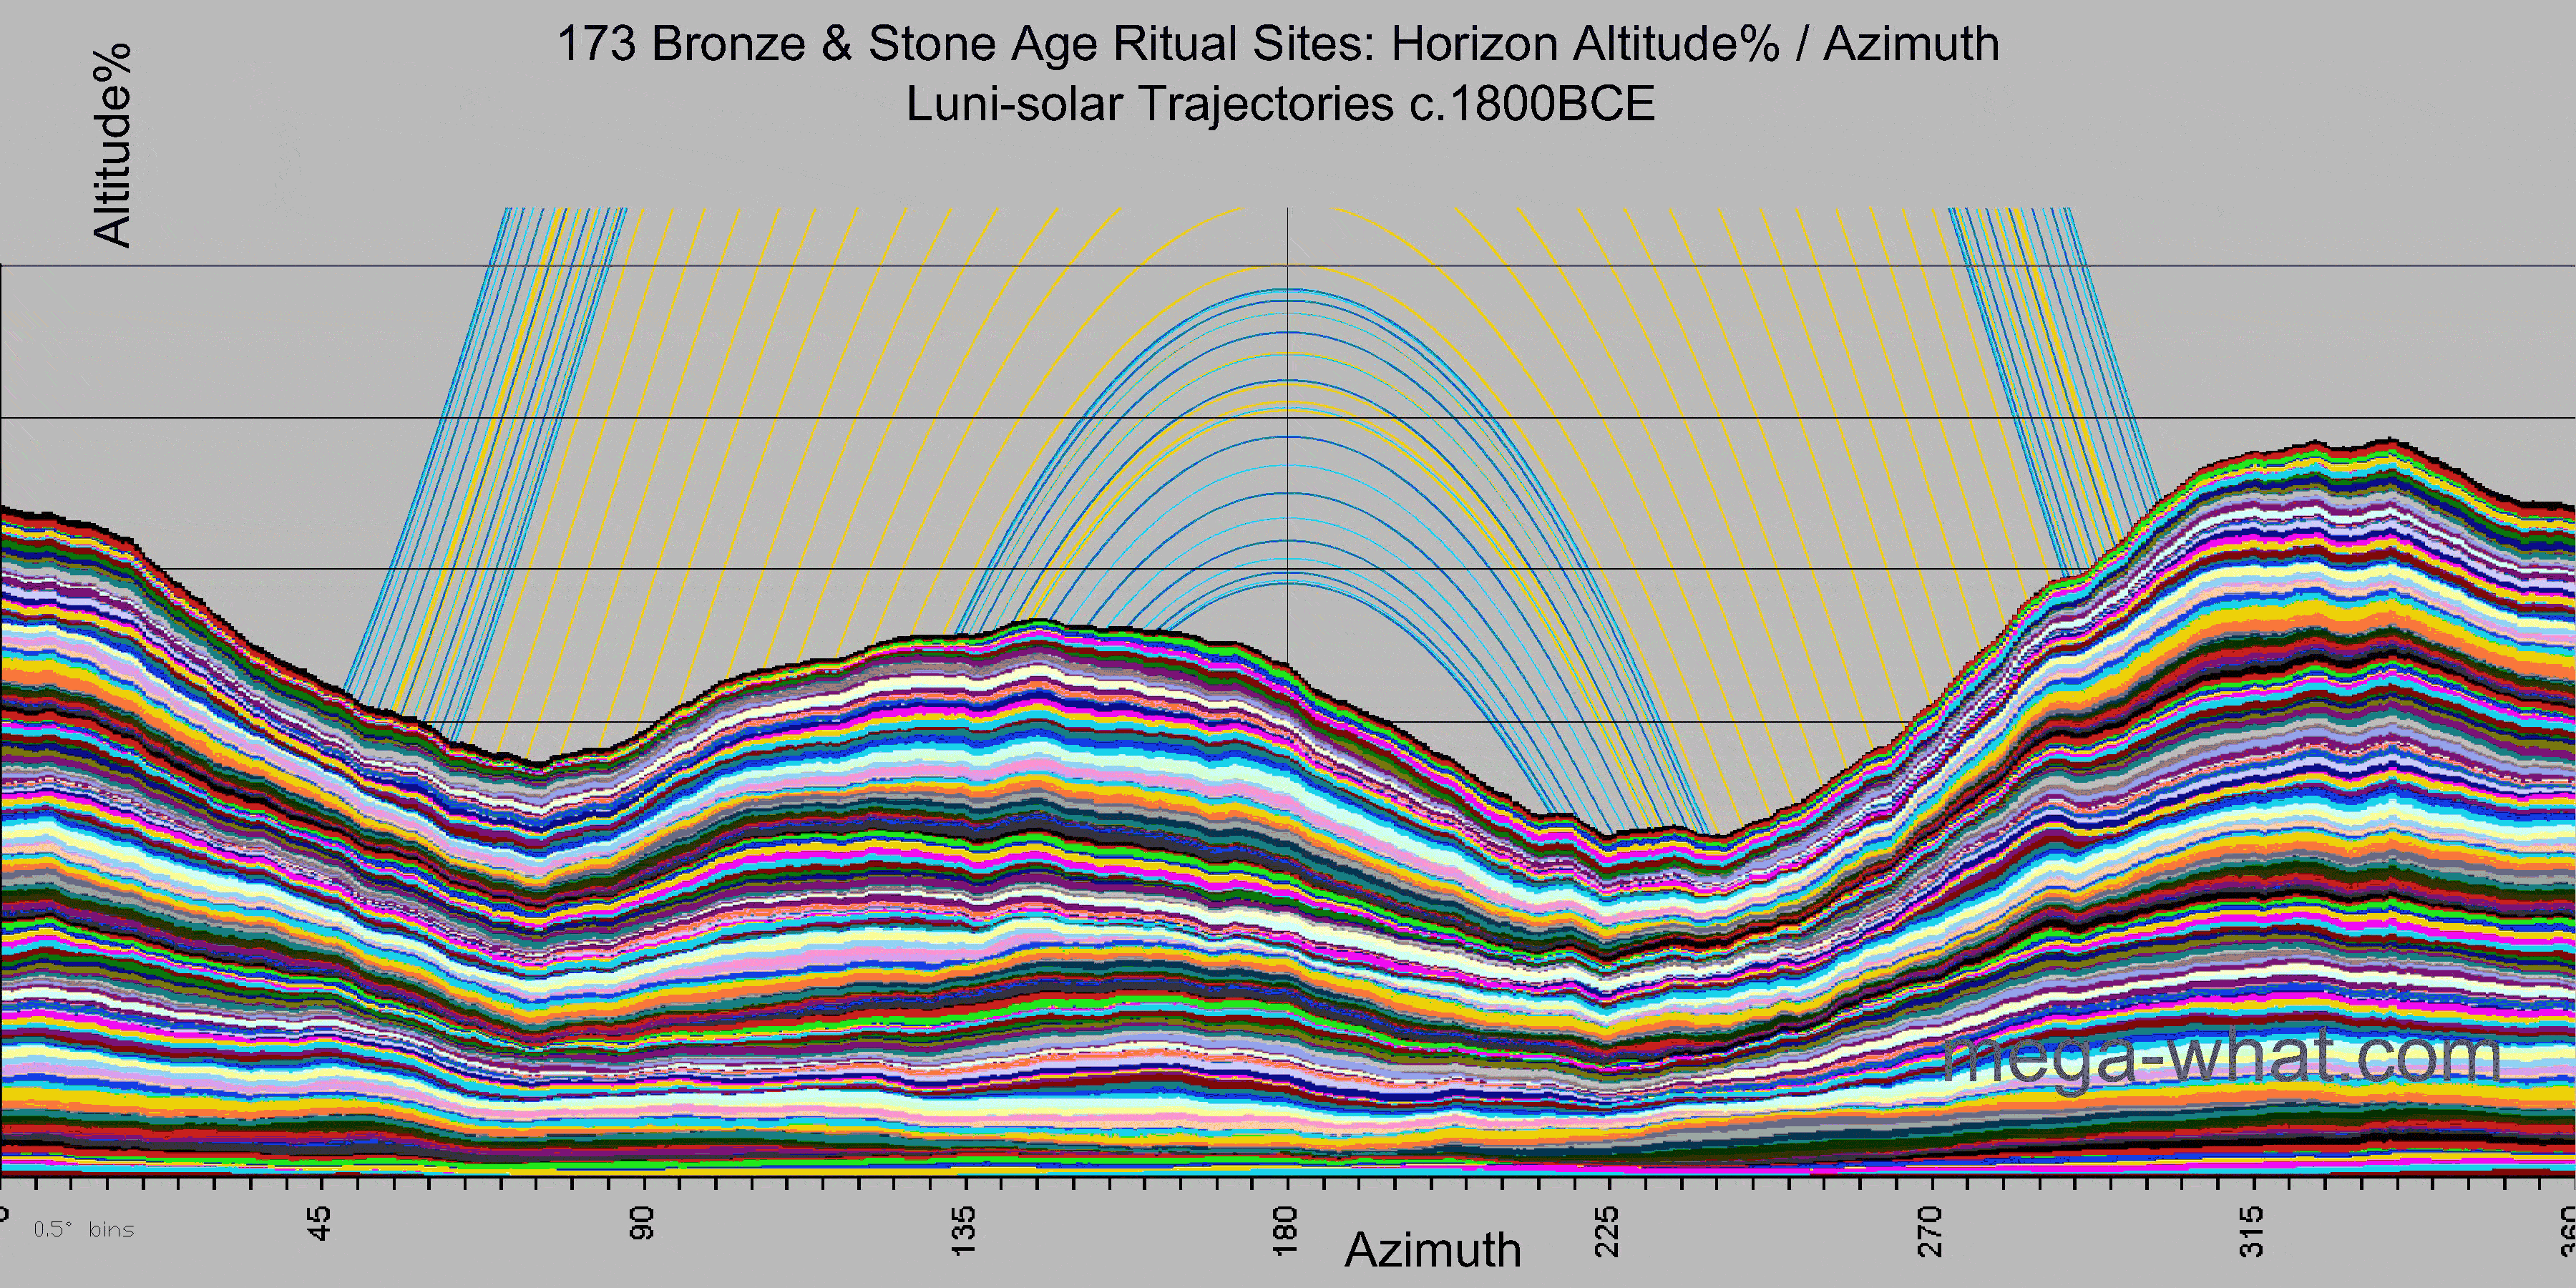
The sum of data from all sites gives an average horizon profile. With added luni-solar trajectories*1 Blue Lunar lines split cyclical lunistice position variation into 16 periods of about 14 months each. Orange Solar trajectories split the tropical year into 48 variable length (7.6 day mean) "Tweeks". it looks like this:
 The highest ground is mostly in the north-west and north, with a lesser concentration in the south-east.
This overall pattern has appeared despite significant individual variability and shows the net result of rises and dips cancelling each other out.
We don't really want rises and dips to cancel each other because hilltops and dip bottoms are equally good as markers:
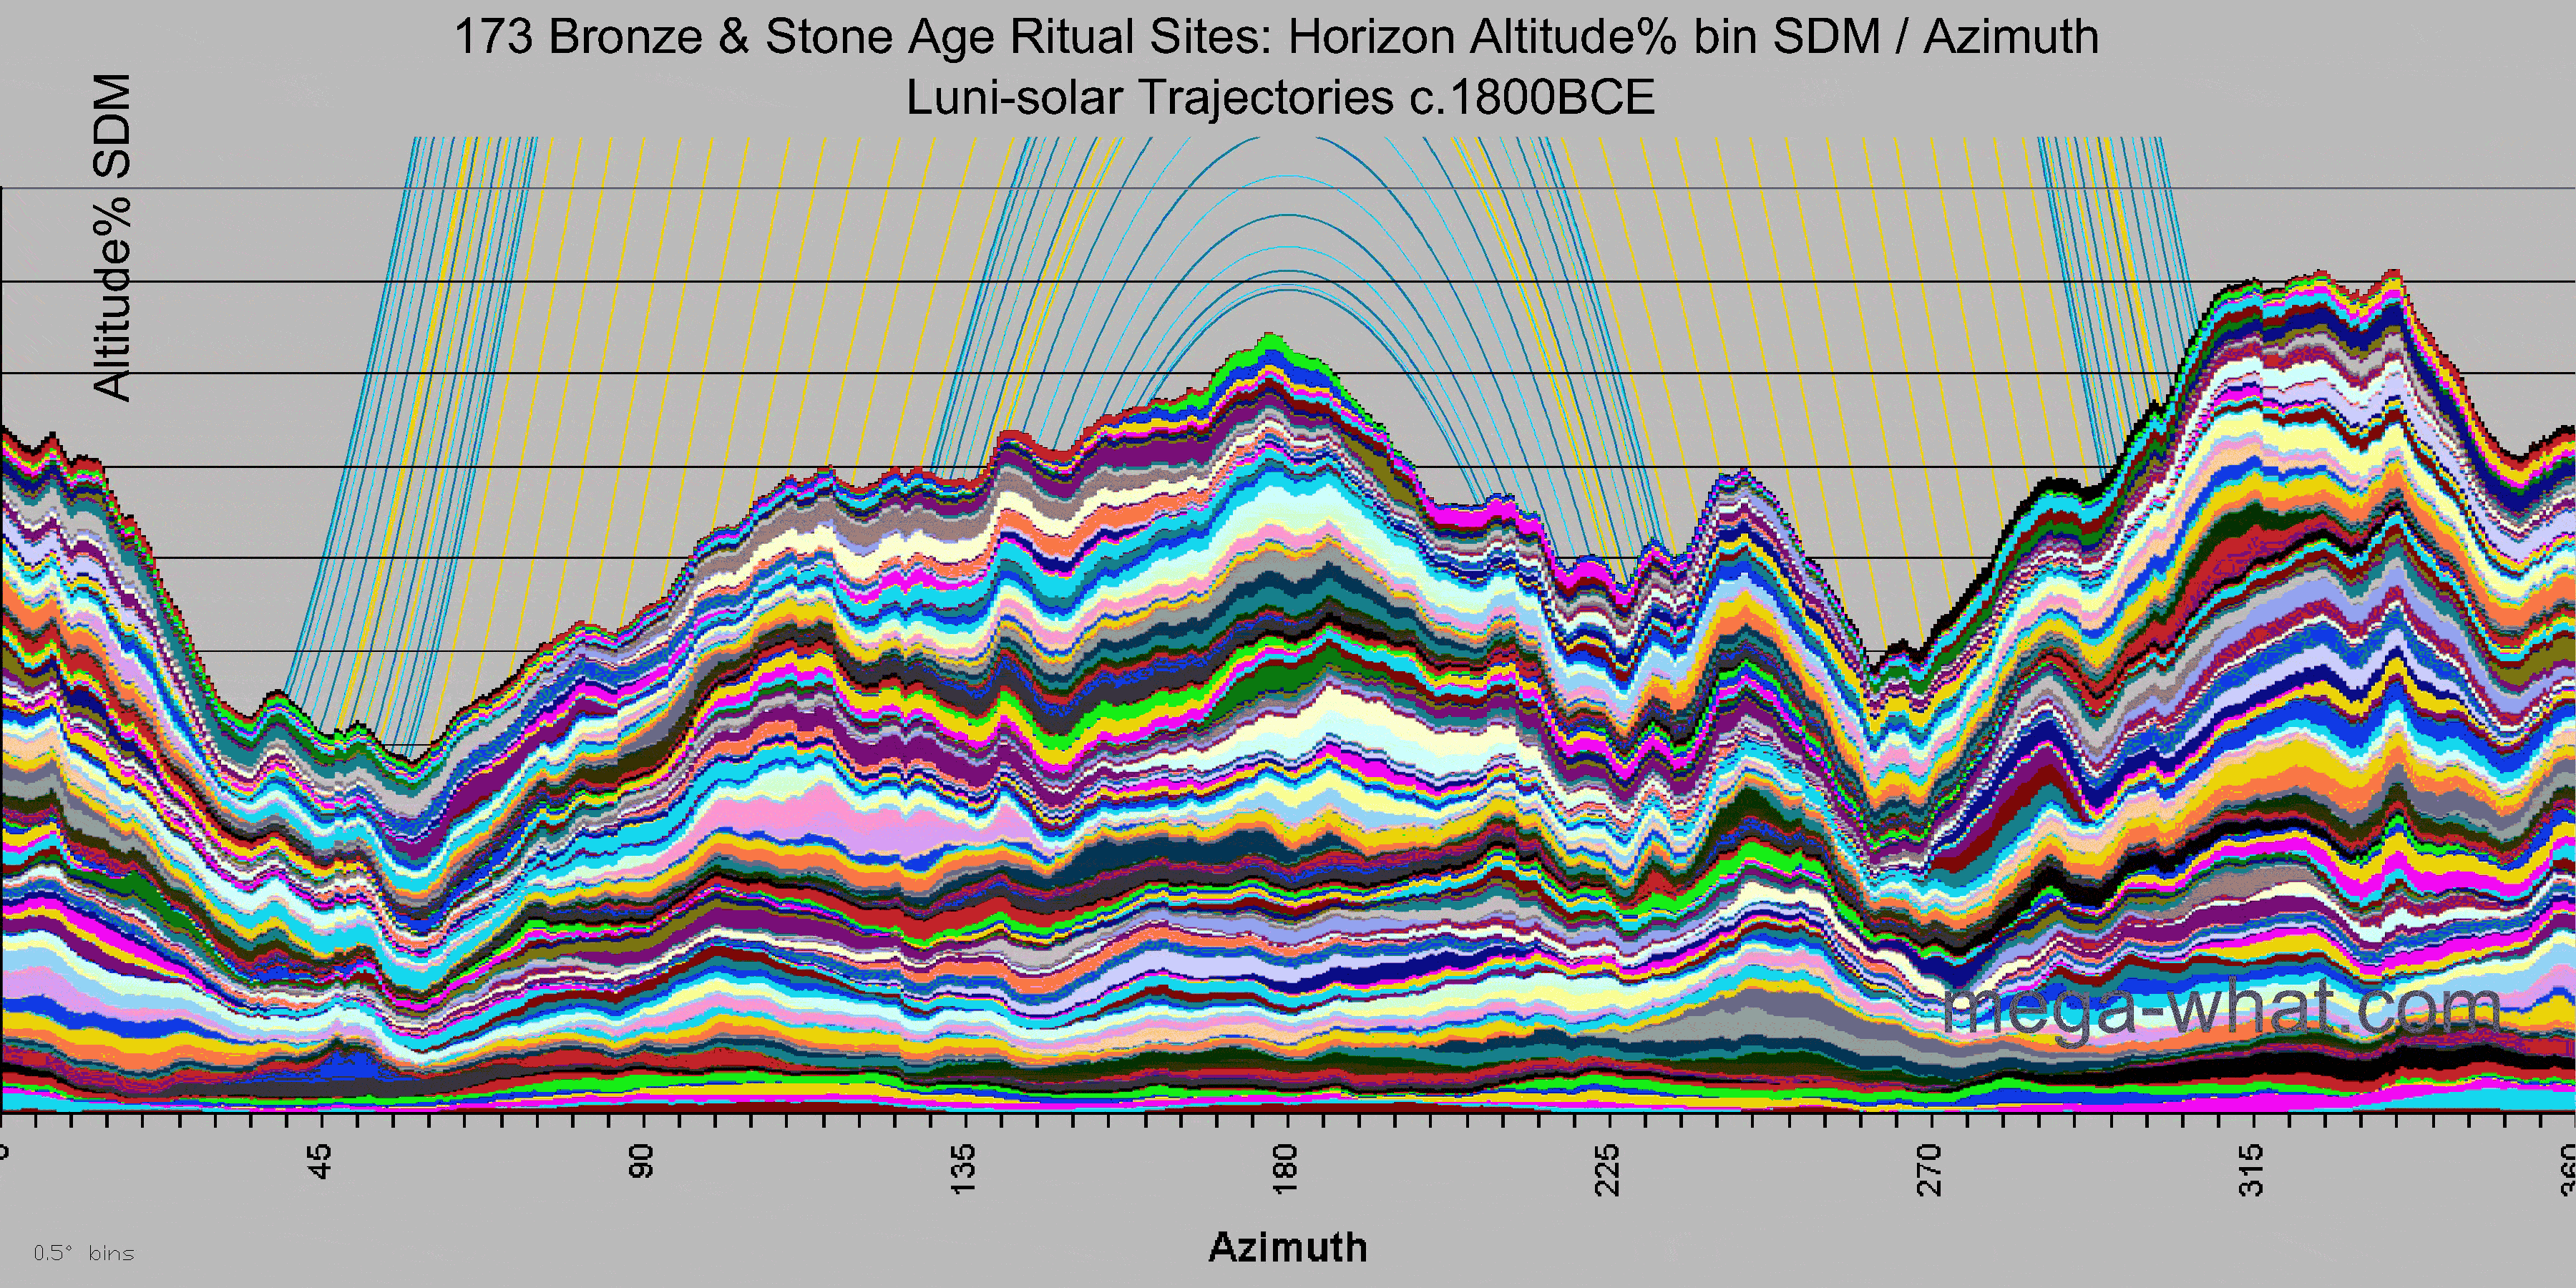
 Square of Deviation from the Mean*2
SDM is the squared deviation from the mean. In this case: Mean horizon altitude% is calculated for each site.
Then, deviation from the site mean is squared and plotted on this stacked bar chart for each 0.5° bin of each site's horizon.
gives more texture to the mathematical abstraction of net horizon profile.
All differences from mean altitude become positive. Rises and dips reinforce each other. Profile is exaggerated, patterns are more obvious.
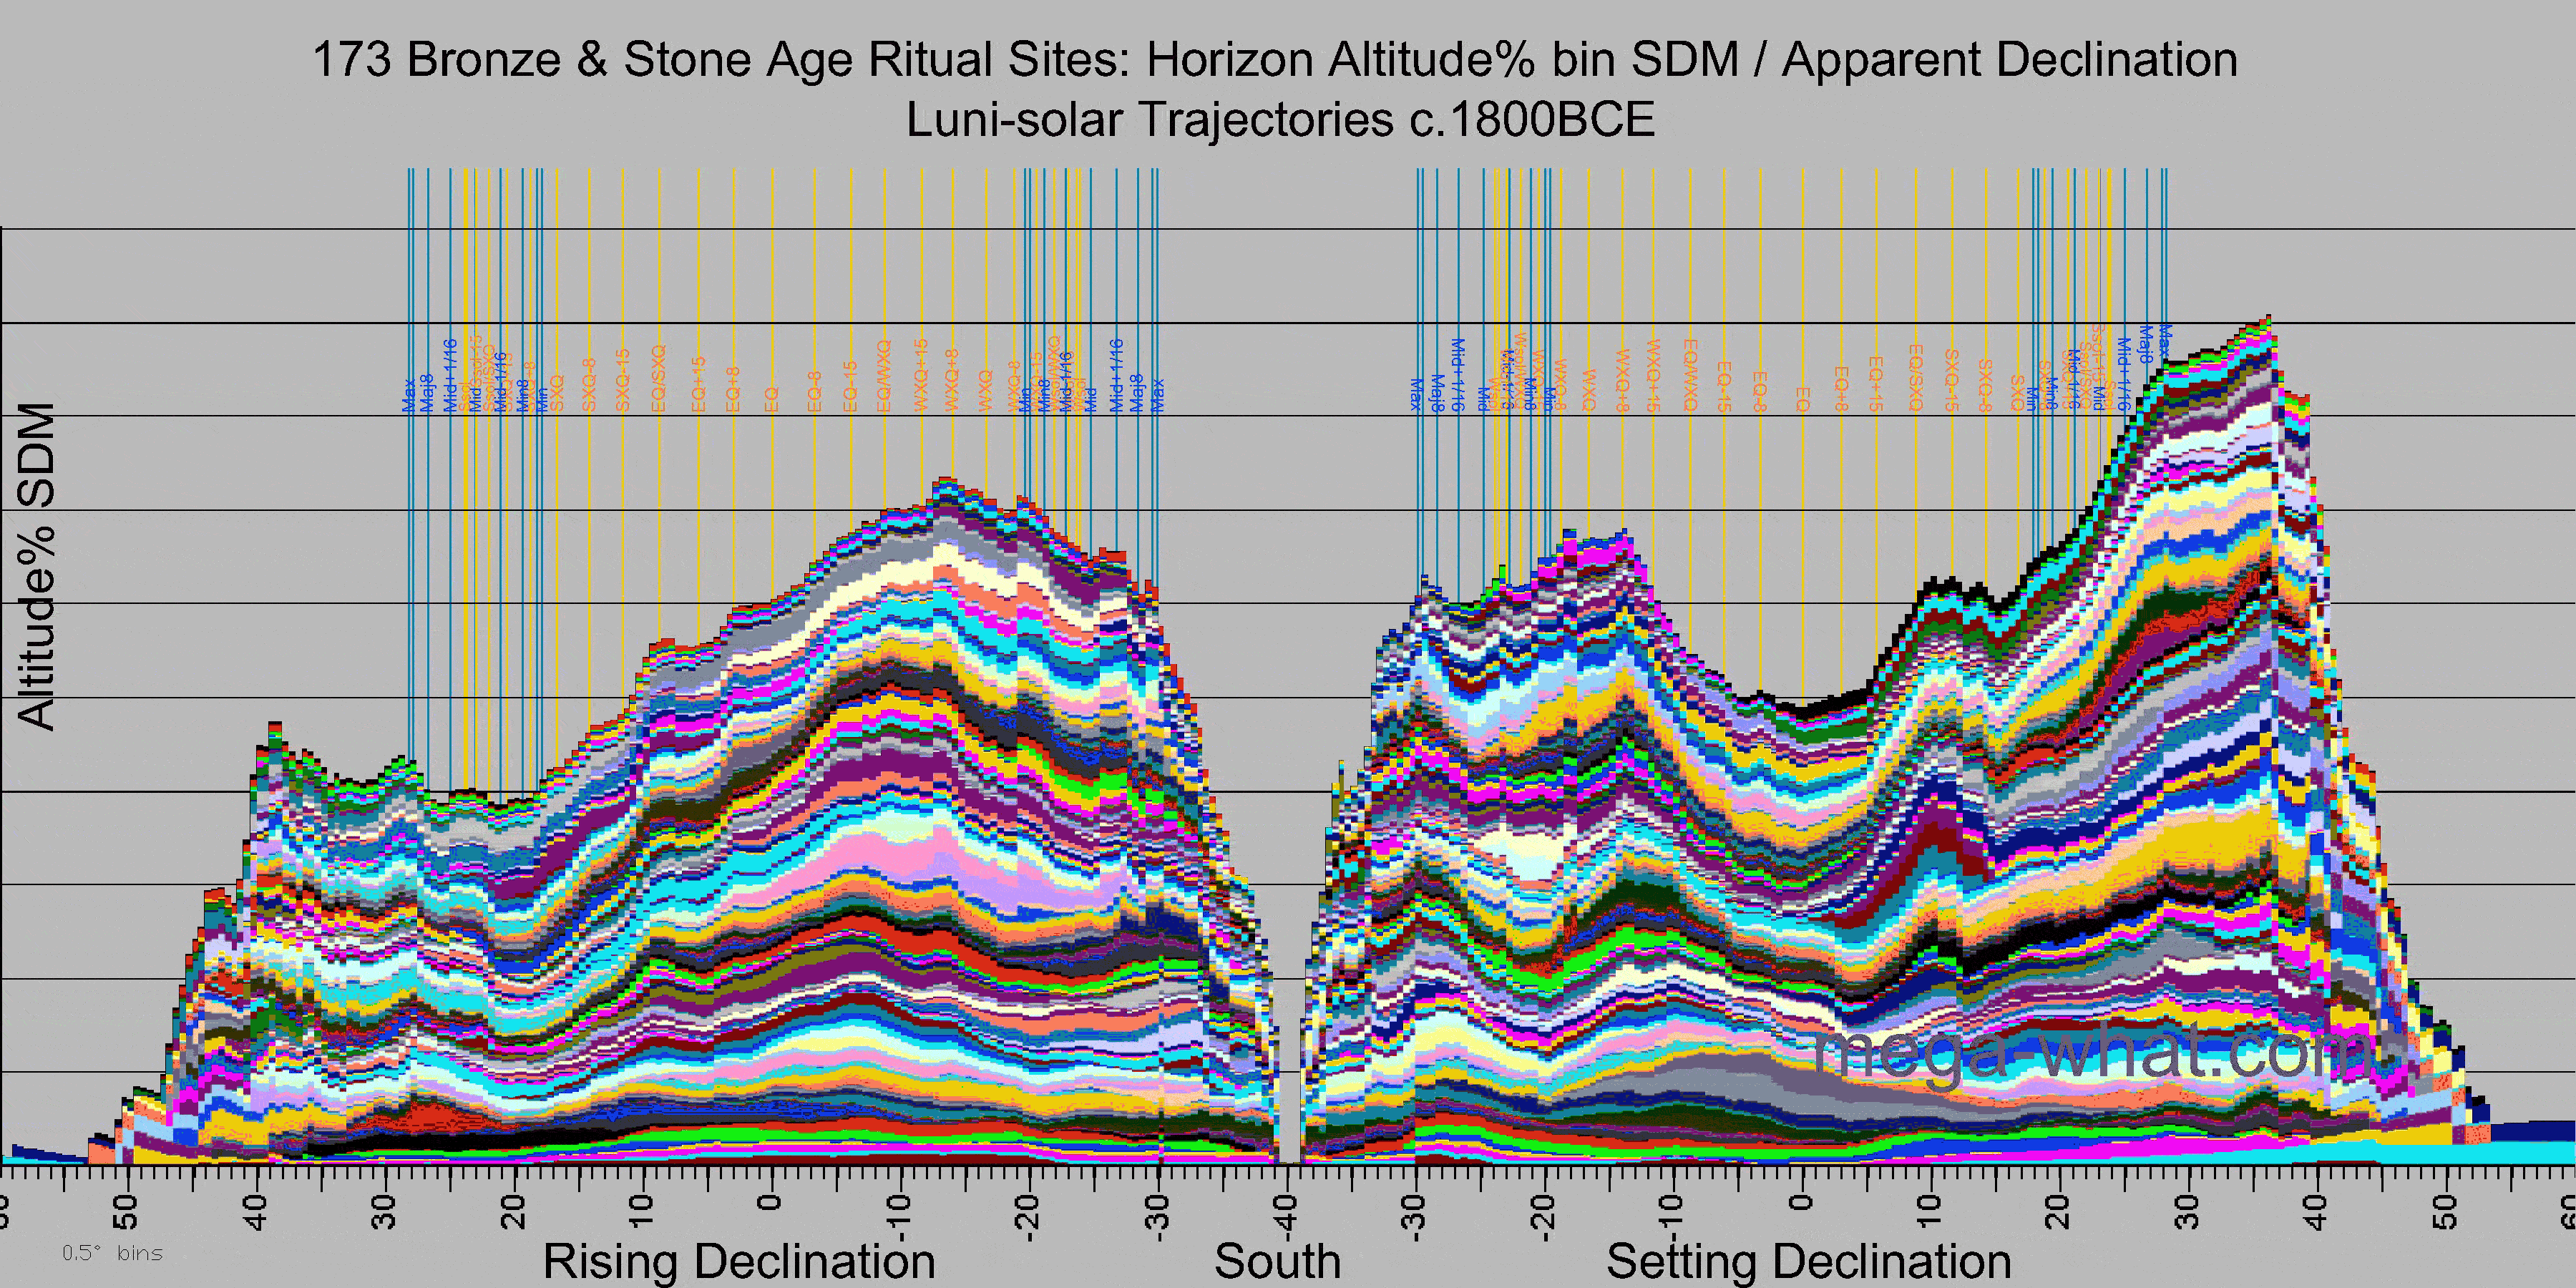
Declination*3Declination is the celestial equivalent of earthly latitude in the equatorial co-ordinate system of sky measurement. Blue Lunar lines split cyclical lunistice position variation into 16 periods of about 14 months each. Orange Solar trajectories split the tropical year into 48 variable length (7.6 day mean) "Tweeks". is the sky measurement we must plot against when looking for correspondence with celestial rises & sets:
Now we can see a clear relationship between luni-solar cycles and the horizon, though perhaps not the expected one. The western equinoctial dip and lack of eastern equivalent are obvious. Peaks south of the equinox are about a week north of the winter cross-quarters, both west and east.
Rises and sets also show statistical peaks around the Southern Lunar Limits (major standstills) Lunistice positions vary cyclically over an 18.6 year period but are fairly static for more than a year at either end of the range. These are the standstills. Major & minor refer to distance from the equinox. though the south-east has recently changed from a simple peak, developing more structure as sample size increases [*4] and there are similar peaks around the Northern Lunar Limits (major standstills) Lunistice positions vary cyclically over an 18.6 year period but are fairly static for more than a year at either end of the range. These are the standstills. Major & minor refer to distance from the equinox.
These statistical peaks propagate right through the series, appearing with even a small sample, as do the significant differences in shape between east and west. This overall shape has been fairly constant but is not fixed and finer structures are still developing as sample size grows. There also does seem to be some potentially significant correspondences between physical actuality and the theoretical calendar sub-divisions.
There are even higher statistical peaks to the north of the major standstills. What's that about? Well, we have already seen a strong tendency towards high ground in the north-west, which would minimise summer sunset after-glow and that would seem to be the most likely explanation. The stepped effect beyond these peaks is an artifact, indicative of different horizon altitudes cutting the sky at different declinations. Similarly and for the same reason to the south.
These prehistoric people seem to have looked for considerable accuracy in at least one horizon sector but also required an overall fit between sky and horizon shape for a place to be worthy of being marked. Patiently optimising spatial relationships between landscape and skyscape by movement and observation they would not have thought about mean altitudes at all. Nevertheless, they must have had some rules of thumb to help them find these Ancient Sacred Places and we may hope to re-discover them if we keep working at it but accurate survey data from many more sites is required...
Out of all the surveyed sites, these are the ones with complete 360° horizon profiles good enough for this type of analysis.
Most are late-mid bronze age sites in SW Cork or Kerry but seventeen are elsewhere in Ireland while nine are in the U.K.
Eighteen are neolithic. Most are megalithic monuments but three are bronze age barrows, three are cairns and three are rock art sites. All show the same basic characteristics!
Clearly there must have been some well understood basic procedure that was common knowledge (to the priesthood at least) throughout pre-iron-age society.
| Category | Smallest | Largest |
|---|---|---|
| Site Latitude | N51.3° | N54.2° |
| Horizon Altitude | -0.7° | 30.0° |
| Altitude Spread | 1.7° | 30.2° |
| Mean Altitude | 0.0° | 14.2° |
| Standard Deviation | 0.4° | 8.6° |
| Mean Altitude% | 9.2% | 63.8% |
| Standard Deviation% | 12.0% | 36.3% |
Horizons do vary a lot from site to site but there is compelling evidence of non-random skyline configuration. Strong suggestions of more specific patterns of overall correspondence as well, even though these simple statistical techniques do not address the greater subtleties of the actual prehistoric methodology, which seem to have been the use of change of slope as a measuring tool.
This study also shows that the vast majority of megalithic monuments do have axes that are obviously astronomically significant: see Axial Alignments
*notes:
- Blue Lunar lines split cyclical lunistice position variation into 16 periods of about 14 months each. Orange Solar trajectories split the tropical year into 48 variable length (7.6 day mean) "Tweeks".
- SDM is the squared deviation from the mean. In this case: Mean horizon altitude% is calculated for each site. Then, deviation from the site mean is squared and plotted as a bar on a stacked bar chart for each 0.5° bin of each site's horizon.
- Declination is the celestial equivalent of earthly latitude in the equatorial co-ordinate system of sky measurement.
- Some of these changes in the mean profile, specifically the ones causing the major end of the lunar cycle to fall progressively down the slope after the southern statistical peak, are due to recent survey of a number of sites where the southern horizon is high enough to cut off some part of the lunar cycle.
This would appear to have most significance in the south-east.
[Tap/click here] for a graph that excludes sites with high enough southern horizons to cut off part of the luni-solar cycle.
